Skip to content
  • Products

    Products

    Astro - Online Category Tracking

    Online market share and category insights for consumer brands and manufacturers

    Tradewinds

    Cube's strategic e-commerce market data offering for investors, internet platforms, and corporates.
  • Technology

    Technology

    Why Cube?

    We achieve best-in-class data accuracy and granularity through statistical and machine learning models

    Data Collection

    Multiple data sources ensure accurate, high-quality insights by triangulating proprietary and external data.

    Data Security

    At Cube, safeguarding data integrity and confidentiality is our foremost priority.

    Product Tagging

    We have the most comprehensive classification system in the industry across platforms and countries
  • Insights

    Insights

    Cube Pulse - Articles

    Stay updated with our latest research, insights, and perspectives on hot topics in e-commerce

    Research reports

    Free to download research reports to help you understand the e-commerce landscape better

    E-commerce Glossary

    We've put all e-commerce terminology in one place so you can find the answers you are searching for

    E-commerce Platform Take-rate tracker

    This tracker provides up-to-date insights into current e-commerce platform take-rates by country and product category, offering a clear view of the marketplace dynamics.

    E-commerce Category Tree

    Cube's coverage follows a unified, standardized category tree across countries and platforms.

    OSCX index

    A benchmark of e-commerce seller sentiment across Southeast Asia and other key Shopee markets
  • Community

    Community

    Shopper Panel

    Join our Online Shopper Panel and answer paid surveys about your habits and opinions about e-commerce

    Seller Panel

    Join the Cube Data Partnership to help us build better insights for the ecosystem
  • Company

    Company

    About us

    Learn more about our mission, credentials, and how we work.

    Our Team

    We recruit great people and help them become better. Collaborate, Innovate, and Lead with Data at Cube

    Careers

    If you love working with data, hold a high bar for quality, and enjoy working with super-smart and collaborative people, Cube is the perfect place for you.

    Contact us

    Send us a question, ask to be contacted, or book a meeting with our expert team today

    Cube in the news

    Cube is frequently quoted in news stories about e-commerce. See our latest coverage here

    Security

    Explore how Cube protects data through enterprise-grade security, strict controls, and recognized compliance standards.

    Trust Center

    Highlights of our high-level risk mitigation strategy, industry best practices, and commitment to continuous improvement.
Contact us
  • Solution
    • E-commerce market data & insights
    • Tradewinds – Strategic Market Data for Southeast Asia E-Commerce
  • Technology
    • Why Cube Asia?
    • Data Collection
    • Data Security
    • Product Tagging
  • Insights
    • Cube Pulse – Articles
    • Research Reports
    • E-Commerce Glossary
    • Shopee Take-Rate Tracker
    • E-commerce Category Tree
    • OSCX Index
  • Community
    • Shopper Panel
    • Seller Panel
  • Company
    • About us
    • Our Team
    • Career
    • Cube in the news
  • Contact us
Titktok background

Beauty brands are the most active on TikTok Shop in Indonesia

  • By Simon Torring
  • November 21, 2022
Link

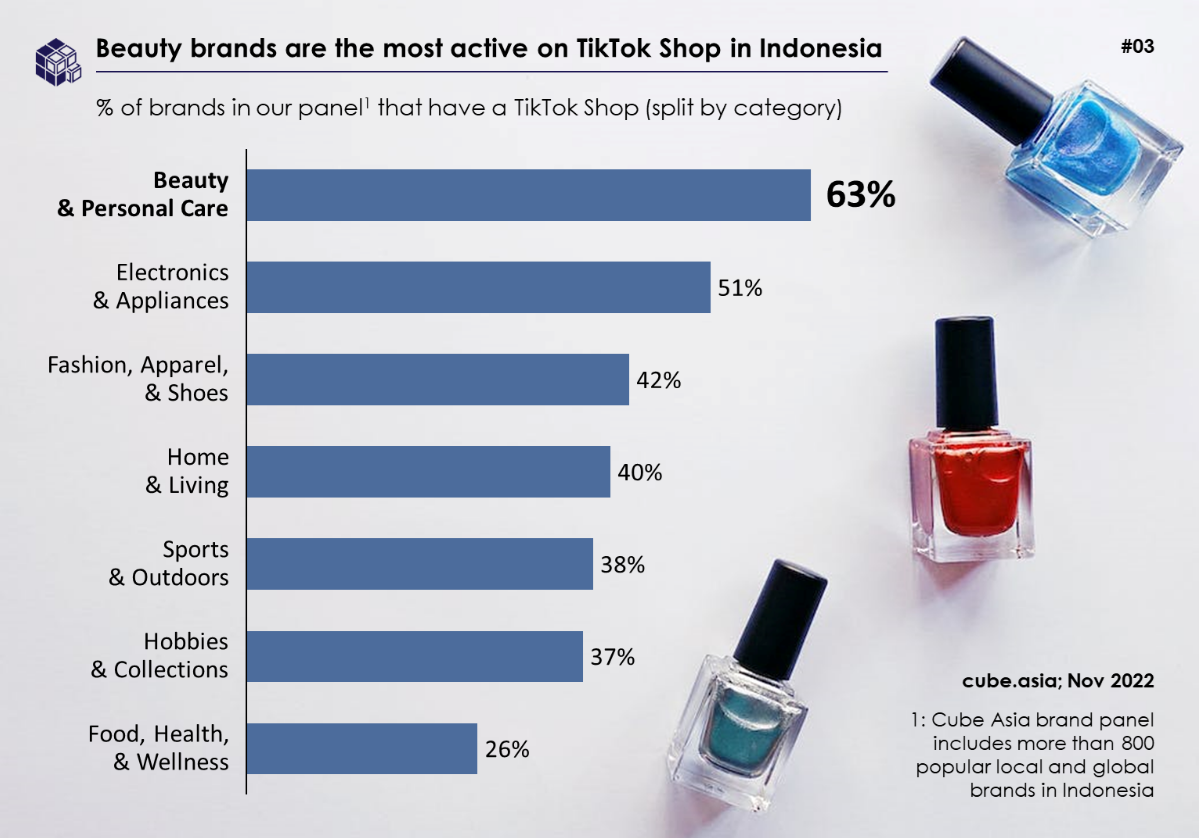
Barely a year after launching TikTok Shop in Indonesia, our latest research shows that an impressive 44% of consumer brands in Indonesia now operate a TikTok Shop account. This insight is derived from our Indonesia brand panel which tracks more than 800 local and international brands with presence in Indonesia. In this post we take a closer look at adoption trends across consumer categories.  

#1: Beauty (63%)

It is not surprising that Beauty is the most active category, with 63% of all brands – and 87% of local beauty brands – operating a TikTok Shop. It offers the ideal combination of user demographics (the majority of TikTok users as well as content creators are women), and engagement dynamics, as the value of a product demonstration on video, and trust in an independent person such as an influencer, is probably the highest in the beauty category.

#2: Electronics & Appliances (51%)

It is however surprising that Electronics & Appliances would be the #2 most active category. Global brands such as Asus, Lenovo, Nokia, Philips, Samsung, and Sony have all jumped on the TikTok Shop bandwagon. A long list of local brands, such as Sekai, Bardi, and Mito, also operate TikTok Shops, each of which have more than 200,000 followers on their TikTok Shops.

#3: Fashion, Apparel, & Shoes (42%)

Fashion is a category often spoken of alongside beauty – also skewing female, and being one of the first categories to have moved online. But fashion brands are lagging behind their peers in other categories, especially global brands. Whereas 72% of local fashion brands in our panel have a TikTok Shop, less than 10% of global brands do!


#7: Food, Health, & Wellness (26%)

Food, Health, & Wellness is the least active category, but that is not unexpected. Not only because most people do not (yet) associate buying food products with TikTok, but also because of TikTok’s own regulations – most food related sub-categories remain restricted, requiring sellers to seek prior approval from TikTok which involves submitting certifications, testing reports, or other regulatory documentation.


Implications for brands

  • TikTok Shop requires consideration if you are not on it already, regardless of which category you’re in. Not only has the platform grown exponentially in user activity and mindshare, it also (at least currently) offers lower commissions than incumbent marketplaces.

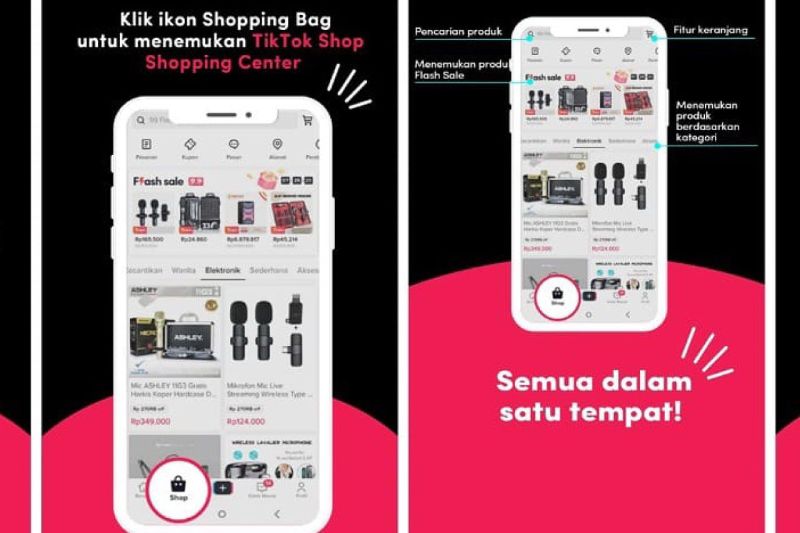
  • If you’re not in Indonesia, you may have an opportunity to be an early mover in your market. Indonesia is TikTok’s biggest e-commerce market, and currently the only one where they have a dedicated Shopping Center, akin to the home screen of marketplaces like Shopee or Tokopedia, inside the TikTok app. The company is likely to introduce that to other markets in the region as well.

  • Competition is heating up. As more of your competitors move to TikTok Shop, it becomes important for you to track their activity – products, prices, content strategies – more closely. This data is not easily available right now, but we are building a solution. Interested? Send us a note at info@cube.asia and we’ll be happy to share more.


Below: TikTok in-app Shopping Center in Indonesia


Access the best insights from our in-depth research of Southeast Asia's social commerce market in 2022
Get the report

Related Articles

Data Analysis, Indonesia

May 5, 2025

Unmasking 'Fake Sales': A Hidden Challenge In Indonesia’s E-Commerce Market

TikTok Shop

February 24, 2025

The best is yet to come: TikTok Shop’s pivotal 2024, and what’s in store for 2025
Top three mobile commerce that is popular in Malaysian market

In the news, Lazada, Shopee, TikTok Shop

February 5, 2025

Go big or go home: Signs of consolidation in Southeast Asia e-commerce

Become part of our e-commerce community

Join 2,000+ other leaders and experts to stay informed about the latest news, insights, and updates

  • info@cube.asia
  • Cube

Products

  • Astro - Online Category Tracking
  • Tradewinds

Community

  • Shopper Panel
  • Seller Panel

Technology

  • Why Cube?
  • Data Collection
  • Data Security
  • Product Tagging

Insights

  • Cube Pulse - Articles
  • Research reports
  • E-Commerce Glossary
  • Take-rate tracker
  • E-commerce Category Tree
  • OSCX Index

Company

  • About us
  • Our Team
  • Careers
  • Contact us
  • Cube in the news
  • Security
  • Trust Center

Copyright 2025 Cube. All Rights Reserved.

Your message has been successfully sent

We appreciate that you’ve taken the time to write us. We’ll get back to you very soon. Please come back and see us often.